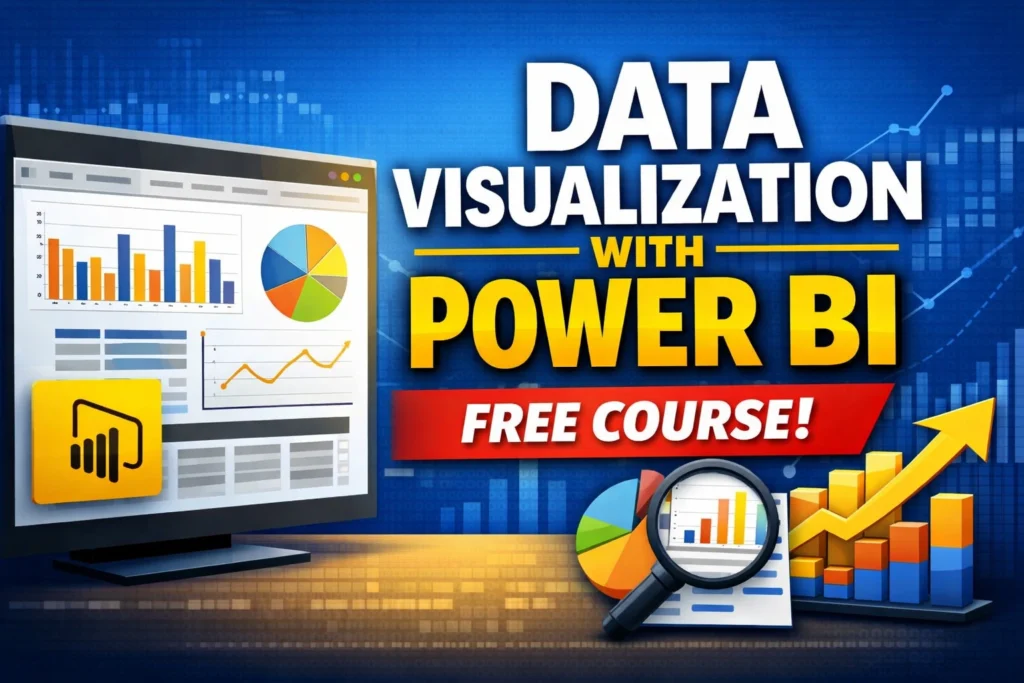
Free Data Visualization With Power BI Course: Complete Review, Syllabus, and Why Beginners Should Take It
A blog-style review for students, job seekers, beginners, and professionals who want to know whether Great Learning Academy’s free Power BI course is worth taking.
If you want to learn Power BI without paying for a beginner course, the Data Visualization With Power BI course from Great Learning Academy is a strong option to consider. It is positioned as a beginner-friendly free course that introduces the basics of business intelligence, data visualization, Power BI tools, report creation, dashboards, and interactivity features.
For many learners, Power BI is one of the most practical tools to learn because it sits at the intersection of analytics, reporting, storytelling, and business decision-making. Companies use it to convert raw datasets into visual dashboards, reports, and performance insights. That is why a free beginner course with a clear structure can be very valuable.
This article breaks down what the course covers, who it is for, the main skills you will gain, the full outline, and whether it is worth your time if you are starting your Power BI journey.
Course snapshot:
- Course: Data Visualization With Power BI
- Platform: Great Learning Academy
- Level: Beginner
- Duration: 2.25 learning hours
- Rating: 4.52
- Learners: 369.5K+ enrolled
- Instructor: Mr. Vishal Padghan
What Is the Data Visualization With Power BI Course?
The Data Visualization With Power BI course is a free online beginner program that teaches learners how to turn data into useful visual insights. The course is designed to help users understand the role of data visualization in decision-making and learn Power BI’s core features for creating reports and dashboards.
What makes this course useful is that it is not only about learning how to click buttons in Power BI. It also introduces the larger business intelligence context behind reporting. This helps beginners understand why data visualization matters, how dashboards support decisions, and how visuals can make complex information easier to interpret.
That combination of theory and practical use makes this course more relevant than a basic feature walkthrough. It gives learners a broader foundation while still introducing the Power BI tools they need to start building reports.
Why This Free Power BI Course Matters
Power BI is one of the most widely used business intelligence tools in modern organizations. It is used for reporting, performance monitoring, executive dashboards, sales analysis, financial reviews, and data storytelling. Because of that, Power BI has become a valuable skill for analysts, students, job seekers, and business professionals.
One challenge for beginners is that Power BI can seem overwhelming at first. There are different views, panes, modeling concepts, DAX functions, and dashboard components to understand. A structured beginner course can reduce that confusion and make the learning process much easier.
This course appears to do that by starting with business intelligence fundamentals and visualization concepts before moving into Power BI architecture, the interface, DAX basics, and report creation. That progression is helpful because it introduces both the “why” and the “how” of data visualization.
What You Will Learn
The course highlights several practical skill areas that beginners can expect to gain:
- Power BI usage
- Data loading
- Creating reports
- Dashboards
- Slicers and filters
- Visual interactivity
These are exactly the kinds of beginner skills that matter in real reporting work. It is not enough to make a chart look nice. A useful Power BI report also needs filters, slicers, data connections, and interactivity so that users can explore information and answer their own questions.
That means the course seems designed to help learners move beyond static visuals and understand how interactive dashboards actually function in business settings.
Course Highlights
The platform highlights three key benefits of the course:
- Get free course content
- Master in-demand skills and tools
- Test your skills with quizzes
This matters because beginners often need more than passive video consumption. Quizzes and skill checks help reinforce the learning process. Even in a short course, that can make the material more useful and memorable.
The course page also places strong emphasis on the certificate side. It promotes an industry-recognized certificate and mentions benefits such as being noticed by recruiters, sharing achievements on professional channels, and supporting job opportunities. For entry-level learners, that can be a helpful added incentive.
About the Course Content
The course description says learners will turn data into actionable insights, create impactful visualizations, and improve their ability to communicate complex information effectively. It also explains that the course covers business intelligence fundamentals, the importance of data visualization, Power BI installation, interface usage, and Data Analysis Expressions (DAX) for dynamic data manipulation.
This is a strong mix for beginners because it combines the conceptual side of analytics with practical exposure to the Power BI environment. Many learners need both. If you only understand the tool but not the reporting logic behind it, you may create weak dashboards. If you understand the theory but cannot use Power BI, you still cannot build practical outputs. This course appears to address both sides.
Full Course Outline Breakdown
The published outline is one of the strongest parts of the course because it gives a clear sequence from BI fundamentals to hands-on report generation.
1. Business Intelligence Fundamentals: Features and Lifecycle
The course begins by defining Business Intelligence and introducing its core capabilities. It also walks through the BI lifecycle, including data collection, data integration, analytical processing, and presentation.
This is a useful starting point because Power BI makes more sense when viewed as part of a larger analytics workflow instead of just a visualization tool.
2. Data Visualization Core Concepts: Data, Story, and Visual Metaphor
The course then moves into the three pillars of effective data visualization: data, narrative or story, and visual metaphor. This section is important because good dashboards are not only about charts. They are about turning raw numbers into understandable visual meaning.
For beginners, this concept can change how they think about reports. Instead of building visuals randomly, they learn to connect information, story, and design purpose.
3. Enterprise Data Visualization Tools: Power BI, Tableau, and Excel
This section compares major BI platforms including Microsoft Power BI, Tableau, and Microsoft Excel. That comparison can help learners understand where Power BI fits in the analytics ecosystem and why it is often chosen for dashboarding and enterprise reporting.
This is especially useful for students and professionals who are trying to decide which tool to prioritize first.
4. Introduction to Microsoft Power BI and System Architecture
Next, the course introduces the Microsoft Power BI ecosystem and architecture, including data sources, Power BI Desktop, Power BI Service, and Power BI Report Server.
This matters because Power BI is not just one app. Understanding how Desktop, Service, and reporting infrastructure fit together gives beginners a more accurate view of how Power BI is used in real organizations.
5. Power BI Ecosystem: Power Query, Power Pivot, and Power View
The course also covers important supporting tools and components such as Power Query, Power Pivot, Power View, Power Map, and Q&A. This broadens the learning scope beyond dashboard visuals and introduces the supporting ecosystem for data preparation and modeling.
For beginners, that is useful because it shows that Power BI involves more than chart selection. Data cleaning, transformation, and modeling are also essential parts of reporting.
6. Power BI Building Blocks: Datasets, Reports, Dashboards, and Tiles
Another section focuses on the foundational building blocks of Power BI. Learners are introduced to datasets, reports, dashboards, and tiles, and how these elements connect together.
This is one of the most important beginner concepts in Power BI. Once you understand the difference between a dataset, a report, and a dashboard, the overall platform becomes much easier to navigate.
7. Power BI Desktop Setup and Workspace Interface Navigation
The course includes Power BI Desktop installation and interface navigation. It specifically mentions working with Report View, Data View, Model View, the Visualizations pane, and the Fields pane.
This is practical and necessary because many first-time learners feel lost when they open Power BI Desktop. A guided walkthrough of the workspace can make early learning much smoother.
8. Data Analysis Expressions (DAX) for Dynamic Data Manipulation
The course introduces DAX and covers calculated columns, measures, and key functions such as CALCULATE and FILTER. This is an excellent addition because DAX is one of the most useful Power BI skills for moving from basic reporting into more dynamic analysis.
Even a beginner-level exposure to DAX can give learners more confidence and help them understand how custom calculations work inside reports.
9. Visual Analytics: Hands-on Report Generation and Interactivity
The final section of the visible outline focuses on practical report creation. Learners connect real-world datasets, use slicers and filters, and design dynamic multi-visual dashboards for stakeholder reporting and actionable insights.
This is where the course appears to bring all the concepts together. Instead of leaving learners with only theory, it moves into actual report generation and dashboard interactivity.
Who Should Take This Course?
This course looks especially suitable for:
- Beginners who want to learn Power BI from scratch
- Students exploring business intelligence and data visualization
- Job seekers who want a beginner-level certificate-backed course
- Excel users moving into dashboard and BI tools
- Professionals who need basic reporting and visualization skills
Because the course is labeled as beginner level and runs for 2.25 learning hours, it seems best suited for people who want a strong introduction rather than an advanced deep dive.
Main Strengths of the Course
Beginner-friendly structure
The course starts with business intelligence and visualization fundamentals before moving into Power BI tools and hands-on reporting. That makes it easier for first-time learners to follow.
Short and accessible format
At 2.25 learning hours, the course is compact enough for people who want a quick but structured learning experience.
Practical skill coverage
The inclusion of data loading, reports, dashboards, slicers, filters, visual interactivity, and DAX makes the course more useful than a very surface-level overview.
Certificate value
The course page strongly promotes its certificate and recruiter visibility benefits, which may matter for students and early-career learners.
Strong social proof
With a 4.52 rating and 369.5K+ learners, the course clearly has substantial traction on the platform.
Possible Limitations
The main limitation is likely depth. Since this is a short beginner-level course, it probably works best as an introduction rather than a complete Power BI mastery path.
Learners who want advanced DAX, enterprise data modeling, deeper visualization strategy, or complex dashboard architecture will probably need additional study after this course. Still, for an entry-level free course, that is a reasonable limitation.
Is This Free Power BI Course Worth Taking?
Yes, for beginners, it looks worth taking. The course offers a useful mix of theory and practical Power BI concepts in a short format. It covers business intelligence basics, data visualization principles, Power BI architecture, interface usage, DAX basics, and report interactivity.
That makes it a solid first step for learners who want to start with Power BI in a structured way. It seems particularly useful for people who want a quick, certificate-backed introduction and enough practical understanding to begin building their own reports and dashboards.
Final Verdict
Data Visualization With Power BI from Great Learning Academy looks like a strong beginner course for learners who want to start with Power BI for free. It combines business intelligence fundamentals, visualization concepts, Power BI architecture, interface navigation, DAX basics, and practical dashboard-building topics in a short and accessible format.
If your goal is to build a foundation in data visualization and Power BI without committing to a long or expensive program, this course appears to be a smart first step. It is especially useful for beginners who want a structured learning path, a certificate-oriented experience, and direct exposure to real reporting concepts.
Frequently Asked Questions
Is this Power BI course free?
Yes, it is listed as a free course on Great Learning Academy.
What level is the course?
The course is marked as beginner level.
How long is the course?
The course duration is 2.25 learning hours.
Who teaches the course?
The instructor listed on the page is Mr. Vishal Padghan.
What skills does the course cover?
It covers Power BI usage, data loading, report creation, dashboards, slicers and filters, and visual interactivity.
Is this enough to master Power BI?
It is best viewed as a beginner-friendly introduction. Advanced learners will likely need more training after this course.
Official course page: Data Visualization With Power BI